Forest Canopy Density (FCD)
The FCD product in specified forests are generated using the Forest Canopy Density Model (FCD algorithm), as applied by (Rikimaru, et al, 2002). TroFMIS approach made slight modification to the original FCD technique, by excluding Principal Component Analysis (PCA), which is computational intensive over large areas, or when computed using high resolution data. The modified FCD approach can be expressed as:
Where, the Advanced Vegetation Index (AVI), like many vegetation index, gives precedence to the areas with healthier vegetation as compraed to the areas with scarce or no vegetation. The AVI was computed as shown in the equation below.
The AVI was directly fused with Scaled Shadow Index (SSI), to yield the ultimate forest canopy densities. i.e. areas with canopy cover while segregating areas with very little or no vegetation. SSI applied the numerical intergration of Blue and Green bands to identify shadow covered areas as shown in the equation below.
The figure below summarizes the steps of generating FCD product using earth observation based methods.
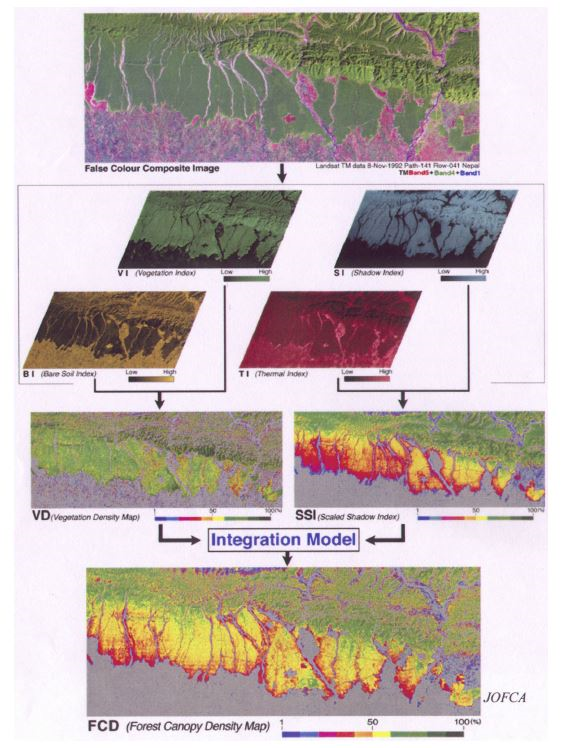
Fig. 1 FCD computation summary.
FCD Data Encoding
The FCD product is rescaled to percentage, using a linear regression model. The values are later reclassified into various Forest Canopy classes. The percentage output values of this equation geovisualises areas of Dense Canopy, Moderate Canopy and Open Canopy between 100 to 65, 65 to 45, 45 to 30 respectively, while the Non- Forest areas were capped at below 30 percent as captured in the table below.
Sensor/Dataset |
Min |
Max |
|---|---|---|
Non Forest |
0 |
30 |
Open Canopy |
30 |
45 |
Moderate Canopy |
45 |
65 |
Dense Canopy |
65 |
100 |
To compute the FCD output, the figure below summarises the steps applied in the computation.
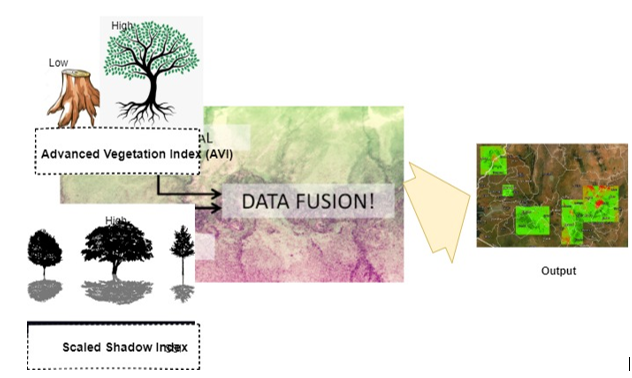
Fig. 2 FCD computation summary.